LESSON 13: More With the Y
Common Versus Rare Y-Haplotypes
Many thanks to Robert Brooks Casey for posting the original formula for weighted values and to Ralph Taylor for doing some heavy duty research and analysis to see how accurate these formulas are. He has written a 27 page article which awaits publication. In the meantime he is proposing a more accurate formula. A huge thank you to Ralph for permission to use his new formulas and charts. It is important to remember that these are based and relatively small data sets so they should be used with some caution–but should give a good indication especially for those in R1b.
Let’s look at two common situations with Y-DNA matches and an explanation for both situations. There are two common complaints with Y-STR DNA testing; The first, “I have 200 matches what did that tell me?” or the second, “I don’t have any matches, why not?” How many matches you get with a 12, 37 or even 67 marker test depends on the combination of Y-STR values that make up your haplotype. If you have mostly common values for your markers you may have hundreds of matches or in some cases the haplotype is so common that it has a name like the “Western Atlantic Modal Haplotype” (WAMH). Or on the other hand, if you have lots of very rare values you may not have a single match. Before I started the WHEATON Surname Project there was one WHEATON who had tested at FTDNA and he had to wait a couple of years to get a single match. This is because the combination of values in the WHEATON Group B haplotype is exceedingly rare. So in the first case testing to 67 markers is necessary to make a positive match and in the second I can make a definite assessment with the first 5 markers that FTDNA tests. That is exceedingly rare.
As Ralph points out in his paper some marker’s have very tight distributions and some are very broad. In other words the values may fall within a spread of 3 values or 5 values or more. All these variables make the goal of determining common versus rare haplotypes more difficult.

Ralph correctly states that the scale is deeply influenced by the number of markers we consider. In his words:
“The scale for measuring commonness vs. rarity must be adjusted to the particular marker sets. Scores on any of these systems will be dependent on the markers used and will be higher with more markers than fewer.”
Therefore adjustments need to be made when considering the commonness or rarity of 12 or 37 marker data sets. To that end he has devised a chart for the number of marker levels. To calculate the rarity of your haplotype use this chart by Leo Little.
First locate your haplogroup (the most common are listed). For each marker, take the highest percentage value and subtract the percentage of your marker value (if your marker value is the highest percentage – use 0 for that marker). Do this for each of your markers and add up the total. For example (for R1b):
DYS 393 = 14 yields .91-.05 = 86
DYS 390 = 24 yields .60-.60 = 0
DYS 19 = 16 yields .89-.01 = 88 and so forth then add all together.
Then use this chart developed by Ralph Taylor for interpreting your results:
| Category | Pct | 12 markers | 25 markers | 37 markers | 67 markers |
|---|---|---|---|---|---|
| Very common | ~5% | 0-0 | 0-99 | 0-249 | 0-349 |
| Common | ~20% | 1-74 | 100-199 | 250-349 | 350-499 |
| Average | ~50% | 75-175 | 200-349 | 350-424 | 500-749 |
| Uncommon | ~20% | 176-249 | 350-499 | 425-649 | 750-899 |
| Rare | ~5% | ≥250 | ≥500 | ≥650 | ≥900 |
This gives you a weighted value of the rarity of your haplotype in general terms for R1b (other haplogroups may have slightly different weightings but this is a good starting point).
The WHEATON DNA Project has the good fortune (or bad depending on your perspective) to have fairly rare weighted values for 67 markers for three of our groups as follows:
Group B = 1,030
Group C = 819
Group D = 878
This means fewer matches but the ones we do get are most likely genealogically related.
In the WHEATON DNA Project the two largest groups weighted values are so high that the the shorthand signatures I developed at the very beginning based on the values of the first five markers work because they contain very rare values. This is not usually the case. These are unusual situations where a 12 marker test may be all that is needed to make a match:
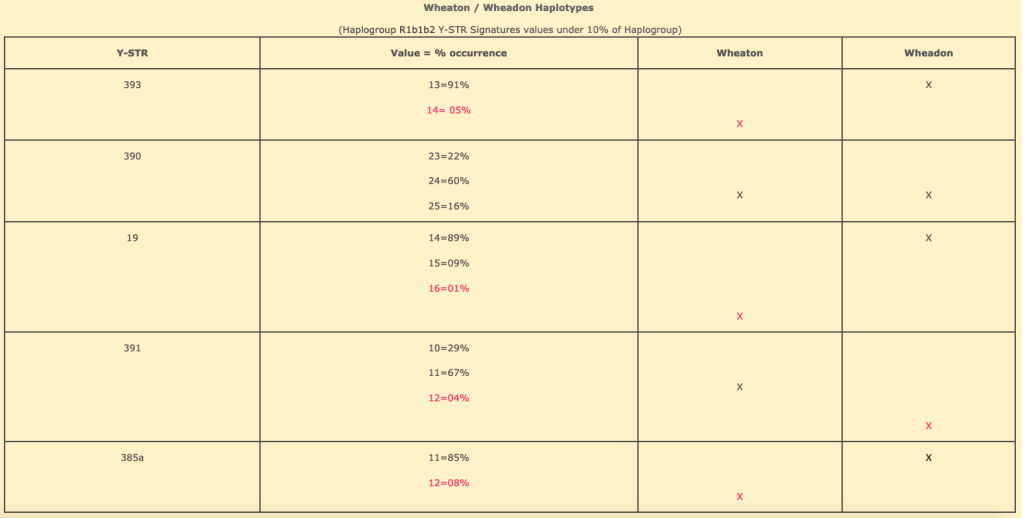
Signatures (first 5 markers) for progenitors of Group B (Robert Wheaton) and Group C (Thomas Wheadon).
Group B Wheaton 14 24 16 11 12
Group C Wheadon 13 24 14 12 11
The chart below shows the first five Y-STR values that comprise the “signature” for Wheaton Group B and Wheadon Group C.
FINDING MORE MATCHES
FTDNA has the largest database of Y-DNA results and surname projects but there are a a few other places you should check for matches. YSEQ.net, For R Haplogroup Alex WILLIAMSON’s Big Tree, YFull and Full Genomes Corp. Some of the older resources like Ysearch and Sorensen’s are no longer available.
If you have few or no perfect matches do not ignore the matches you have. Also expanding markers from 37 to 67 or 67 to 111 will often help with matches. Sometimes due to the luck of the draw the most unusual values are loaded “up front” in the earlier panels and it skews the odds in favor of a non-match. This can happen at 12, 37 or 67 markers. Sometimes a 11/12 is a true match, even though the vast majority of the time it is not. (We have one of these in WHEATON Group B) Its all based on statistics so the odds might be low but then someone gets the long shot every now and again.
MRCA and MUTATION
All the estimates of time to MRCA (Most Recent Common Ancestor) are based on statistics so they are a ballpark “estimate.” It is often said “mutations happen when they happen.” So even if the average mutation happens every 20 transactions it can happen between your father and you or there may be 14 generations without a single mutation.
Some markers are more prone to mutations than others and are noted by FTDNA with a red or burgundy color. This chart on the Mutation rates of Y-STR markers came to me by way of several others (it has been extracted and added to by many also see*). I suggest adding it to your “Cheat Sheet File” especially if you are an Administrator for a Y Surname Group. Even among different haplogroups and haplotypes some markers are more prone to mutations than others. The more you become familiar with your marker values and their frequencies the more you can make educated deductions about the relatedness of any two individuals. Do not depend on surnames for making your assessments–better to follow the DNA!
A European Journal of Human Genetics’ article supports what I had suspected long ago; that mutation rates vary widely and there is a lot more mutation than previously suspected. Read full article here. Here’s a quote from the article: “Our approximation allows more detailed results by achieving an adjusted mutation rate for each locus [marker] separately. The same methodology could be used to estimate population or lineage-specific mutation rates, as different lineages and populations are often characterized by specific allele combination and mutation rate seems to be affected by allele size and structure.”
Translation: a match of 33/37 might be a better match than 35/37 depending on the markers where differences occur. Or in other words: which markers mutate matters and they matter specifically within our haplotypes.

A NON-MATCH Can Be a Match Too! Please have a close look at Kit 261919. If we went off the first 12 markers this would be 10 out of 12 which is not considered a match. As mentioned above the Haplotype for Group B Wheaton 14 24 16 11 12. However as the screenshot from my project shows we have several folks who do not match this Haplotype that are indeed Group B matches. The Kit 261919 I would never have guessed in a million years. He is 14 24 15 11 11. So 3 of 5 or 10 of 12 markers are mismatches or off modal. And please note he is a solid paper trail match with Kit 247998 and they are 34/37 markers. They are both descended from the same son of the immigrant so share a common ancestor about 350 years from their births. Also note the cluster of 14 24 16 12 12 although different surnames clearly related. [Note frequency differences from the Group B modal are towards the average or more common frequencies.] At 13 markers this is 10/13 and no one I know would consider that a match. But in fact it is! at 37 Markers it is 34 out of 37 also written -3 at 37 (34/37). All of the variations fall in the first 13 markers. And as you can also see from the Green Haplogroup this is a match with other testers in the project. So although most of the time it is a safe bet to go with statistics—it can sometimes lead you astray.
Do not ignore hunches, trends and historical or genealogical evidence. When I began my search for WHEATON Group B (R-L2) I was told there weren’t any R-L2s in SW England but it turns out they just occur there in very low frequencies (as they do all over Great Britain). The 5 surnames in WHEATON Group B did not make any sense until I managed to track each surname to men living in the same community in the same time frame even though they range from northern England to southern Wales to southwest England to Massachusetts.
The future of Y testing: when SNPs and STRs meet
In the past, conventional wisdom viewed Y-STR’s as markers that mutate rapidly approximately every 175 years or more and are used for proving relationships in a genealogical time frame. SNP’s mutate much more slowly maybe once every thousand or ten thousand years so they point to our deepest ancestry. However, the time has arrived where SNPs represent recent events and the gaps between the two are being bridged. The dropping price of Next generation Y-testing including new technologies for uncovering more and more Y SNPs means we are literally able to trace a man’s Y-DNA from his familial surname group to his recent origins and back through ancient migration routes back to the earliest human origins.
In the future the price of comprehensive Y testing, which is currently less than $500, may approach the price of a 37 marker kit of a few years ago. The whole field of genetic genealogy has progressed rapidly over the past few years and early adopters of the technology have spent thousands where now you might spend hundreds. I In addition to better coverage at lower costs there are increasing numbers of men across the globe who have tested and with them the ever increasing odds of being able to discover a mans’ genealogical and ancient connections. The efforts of citizen scientists in the field of genetic genealogy are meeting the deeper scientific pursuits of anthropologists and population geneticists and bringing us “up close and personal” to our place in the greater human family tree.
LESSON 14
ADDITIONAL RESOURCES
Mutation rates of Y STR Markers by Leo Little
The Testing of DNA Holds a Bright Future by Robert Brooks Casey
A confusion of SNPs by Debbie Cruwys Kennett
Additional Y Tools by Kitty Munson Cooper
*Eur J Hum Genet. 2011 January; 19(1): 70–75. Published online 2010 September 8. doi: 10.1038/ejhg.2010.154
Kelly Wheaton Copyright 2020. All Rights Reserved.
