LESSON 8: Ancestral Origins Part 2
Finally here’s the fun part where we take a closer look at each company’s Ancestral Origins output. Each company has different algorithms and different graphics for reporting your ancestral origins. They also go by different names:
Ancestry: Genetic Ethnicity Estimate
Family Tree DNA: Population Finder
23andMe: Ancestry Composition
Living DNA: Ancestry
MyHeritage: Ethnicity Estimate
In this lesson we will look at samples of each. Clearly if you are 100% of a particular ancestry this is not going to be as interesting. The various products vary in both accuracy and specificity and what works best for you may depend on your ethnicity. Improvements in the past couple of years particularly at Ancestry and 23andMe are yielding more geographical specificity and more reliable results.
ANCESTRY
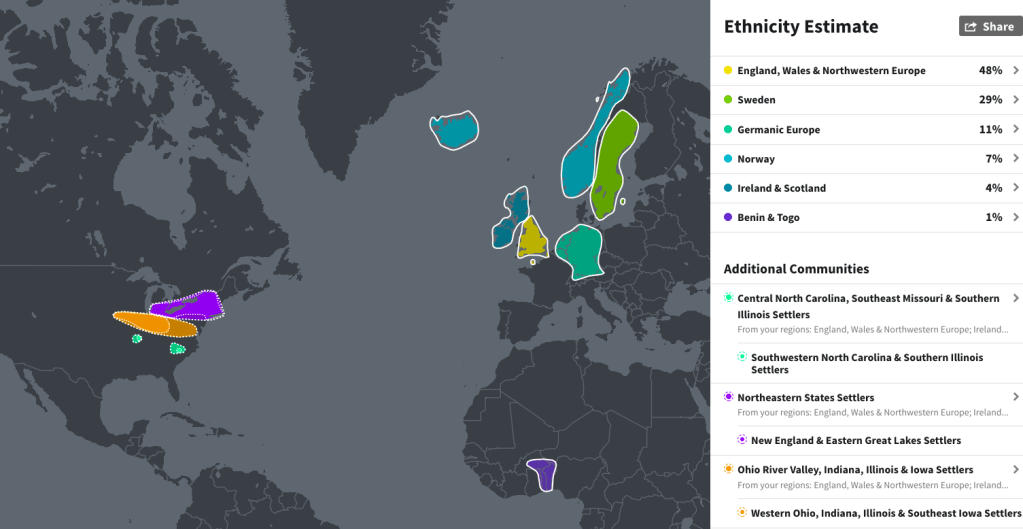
Note in the Ancestry DNA in addition to the broad breakdown you may be assigned various communities. These are accurate in my case. Below is a particularly interesting community for my husband. He has more recent ancestry from Europe so he gets more specificity in his results.
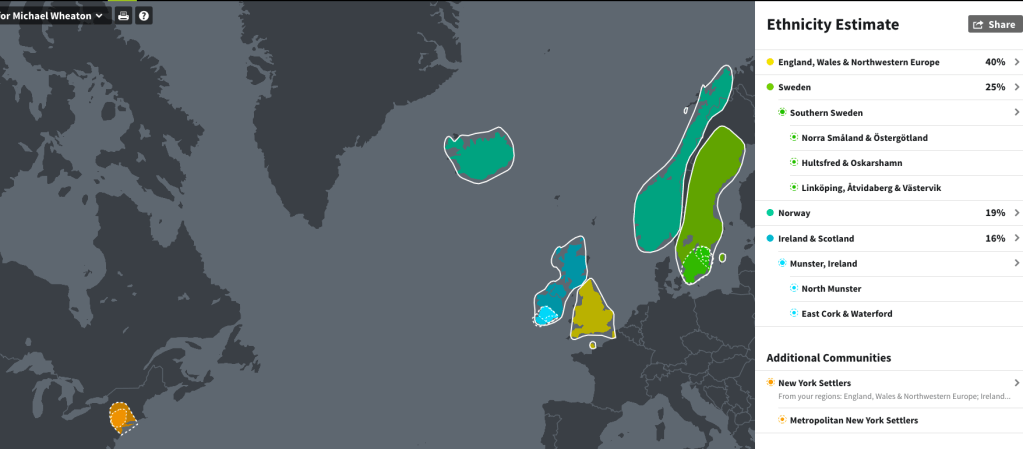
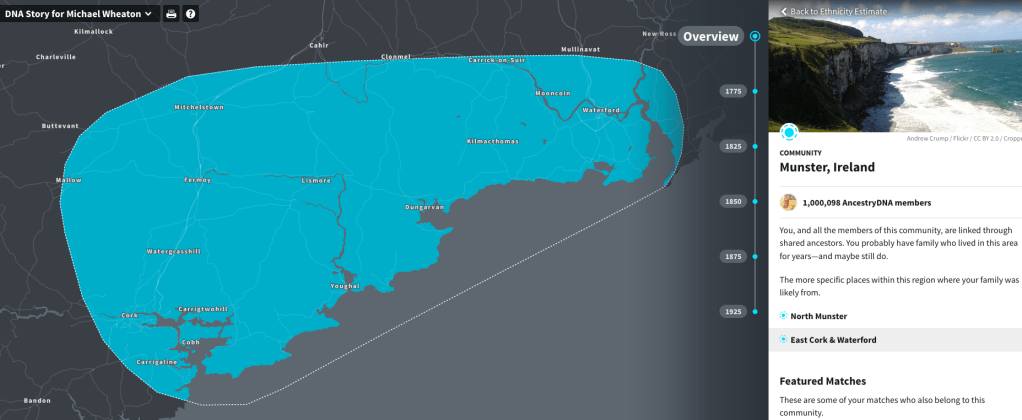
And finally zeroing in on my husband’s it get’s confined to a specific area, in this case Munster. Please note on the right where it says featured matches. These are matches that share the same specificity. And if you scroll down on the right side there’s lots more information to explore.
FAMILY TREE DNA
FTDNA lags behind in its Ancestral breakdowns and I do not find them particularly accurate. I may have Finnish, but if I do its back over 400 years ago. Likewise I only have a small amount of Southern European in a genealogical time frame and they fail to include amounts under 1% so my African does not even register. FTDNA also includes all my German and French in with the British Isles. Probably my least favorite among the 5 major companies.
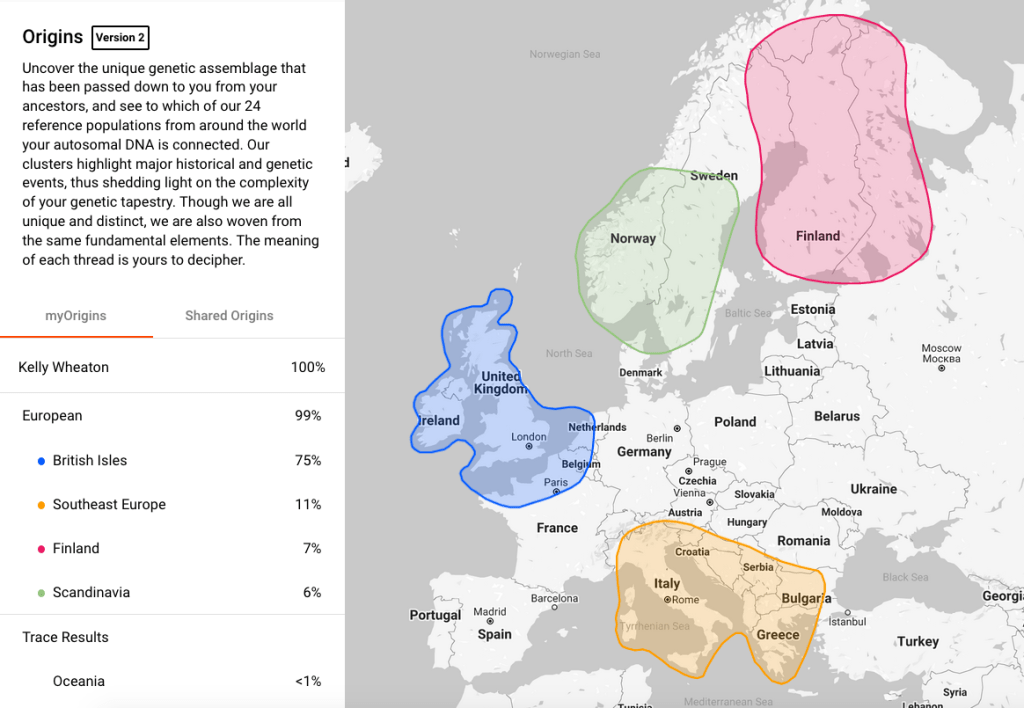
LIVING DNA
Living DNA’s results are curious for me. There is just no way in the world that I have 23.1% of my DNA from Italy. As far as I know I have not a single ancestor from Italy. The area where all of my German ancestors come from is in the white part of the map. The map from the British Isles is accurate for as far as it goes but it misses a good part of my ancestors from the Midlands. So This is a really mixed bag.

23ANDME
23andMe’s Ancestry Composition is excellent with lots of specificity. They pick up my African with even a finer area than Ancestry. The .9% Southern European is more accurate than the 23.1% at Living DNA and the 11% at FTDNA

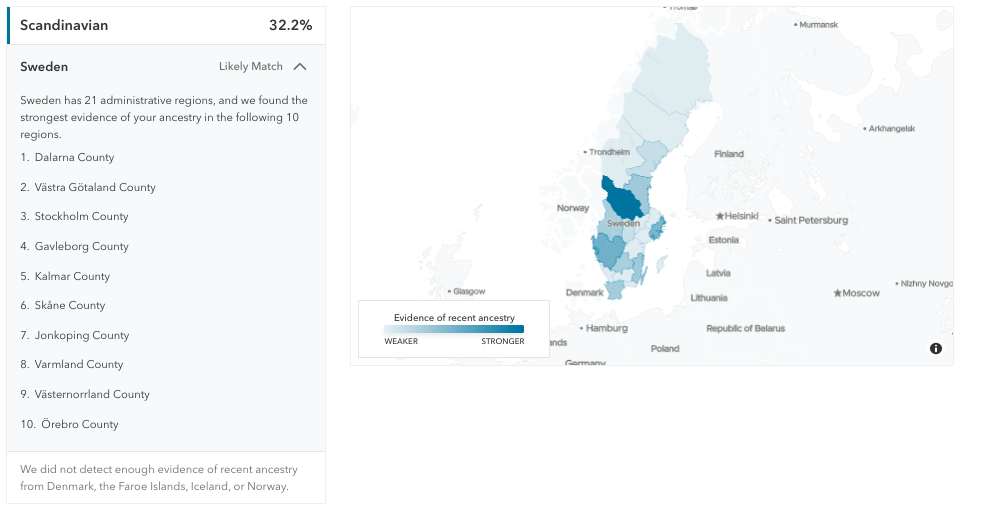
Clicking on a major category will bring up a report with more detail, showing likely ancestry in the last 200 years. Below is my Scandinavian Ancestry. I have a nearly complete tree of both my Swedish and Norwegian ancestors back to the 1600’s. My top region is Dalarna which is correct. The other regions from which I have known ancestry is Jonkoping, listed as #7. Some of my Jonkoping ancestors were briefly in Vasta Götland which is #2. Where 23andme fails is in picking up my Norwegian 3rd great grandmother who was from Telemark and all her family back as far as there are written records. She was born in 1827 and I have matches in Norway from Telemark. However I have only a quarter of the Norwegian ancestry than Swedish.
But this is not the only thing to love about 23andMe’s Ancestry Composition. They also “paint” the chromosomes!
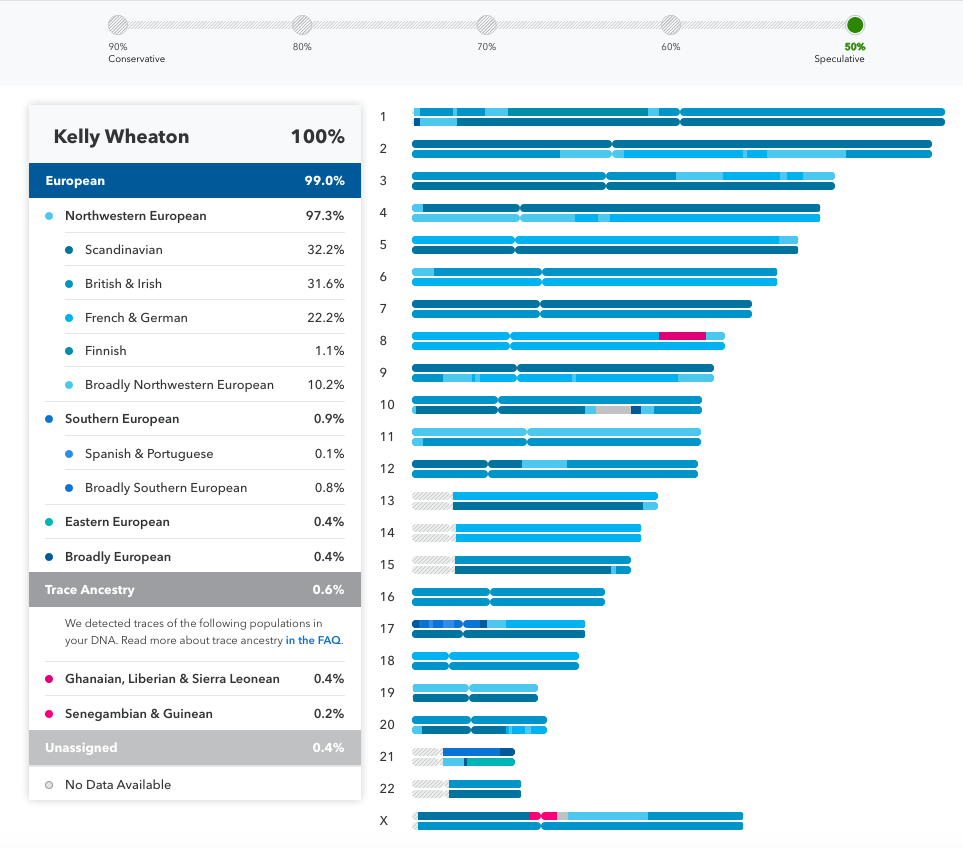
So this color codes segments on both sides (Mom & Dad). It also allows you to change the degree of confidence by sliding the bar across the top. This image shows it in speculative mode. Interesting to e is a previous iteration showed the gray segment on chromosome 10 as African and now it shows a new segment on the X as Senegambian & Guinean. For those of us the track the segments of our matches this information can prove very helpful. Note: that by clicking or hovering over any of the categories only those of that category will show up on the right.
MY HERITAGE
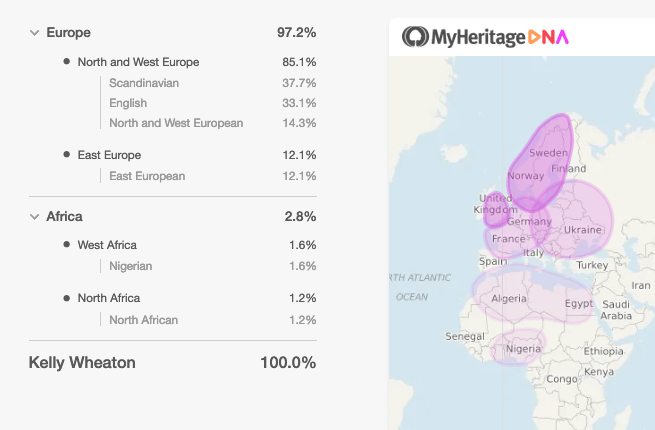
In this case both parents and child have been tested allowing you to see what ancestry the child has inherited from each parent. The tools illustrated above from 23ndMe and the specificity they give make it my first choice for testing multiple family members.
COMPARISON
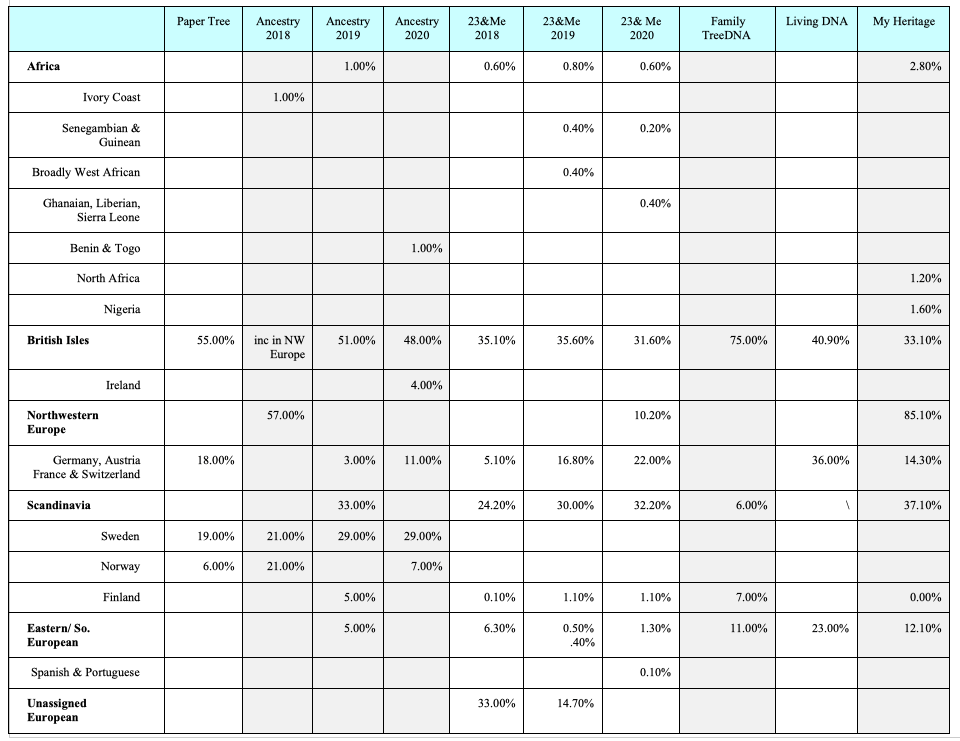
In the second column is my paper genealogy tree estimate. For Ancestry and 23andMeyou can see how their estimates have changed over time. I have one Scandinavian grandparent. Although possible I think the Schandinavian estimate from My Heritage at 37% and current 23andMe at 32% and Ancestry at 33% may be a bit high. This wold mean I only got 13% of my maternal grandmother’s DNA and 37% of my grandfather. I think I did get more of his but not that much more. I tend to think that my western Yorkshire and Scots Irish may be skewing this a bit.
ESTIMATES
Please view all these as estimates constrained by the number of AIMs and the datasets at each company. As you can see above they will change over time and that some companies are more accurate than others. These are getting better all the time and that is a very good thing for us.
Before I leave this topic I want to share with you a map of the Europe That Was. Interesting to look at how current countries were not so far apart 9,000-18,000 years ago. And poor Doggerland is no more! No wonder DNA ancestral breakdowns sometimes have a hard time conforming to our expectations for discrete categories matching up to current countries. Please remember that these predicted ancestral origins are perhaps the sketchiest part of DNA testing and need to be taken with a teaspoon of salt. In the future they may be more reliable, but for now they are still rather speculative.
LESSON 9
ADDITIONAL RESOURCES
Using Gedmatch for Ethnicity Chromosome Mapping by TL Dixon
Native American DNA is Just Not That Into You by TL Dixon
EThnicity Chromosome Mapping & Determining “Ethnicity” of shared DNA segments between related individuals by TL Dixon
Doug McDonald on Biogeographical Analysis as posted by Roberta Estes
AncestryDNA Launches New Ethnicity Estimate by Blaine Bettinger
AncestryDNA Tech Blog Anouncement
AncestryDNA Begins Roll-out by Judy G. Russell
Genea-Musings Blog Post on Ancestry DNA New Ethnicity Estimate by Randy Seaver
Kelly Wheaton Copyright 2020. All Rights Reserved.
