Why Numbers Matter
Although this is specific to Group B I hope all of you will take a look. I am enclosing two matrix charts which show the number of mismatched markers in Group B at 67 Markers and then at 111 markers. Although it doesn’t look like much there is a lot to be gleaned here.
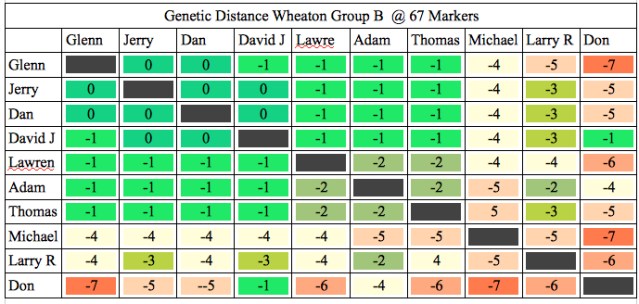
This Shows how closely related are the first 7 where each is related to the others with no more than 2 mismatches. Dan Hancock is closely related to Glenn, Jerry & David Joe. And Thomas Mallenby is not far behind. By comparison Larry Raines is -3 to -4 with the core group which is closer than my husband Michael who is -4 to -5 with core members. But look what happens when we add another 44 markers. Also of note is the relationship between Larry Raines and Adam which suggests a more recent common ancestor. Also Adam is the closest match for Don Howell.

The core Wheaton group holds pretty tight. My husband who was an outlier at 67 does not increase the number of mismatches with the Wheaton core group. In fact he stays at -4 with David Joe (no change) but adds -5 for a total of -9 with Thomas Mallenby. Dan Hancock shows how strong his match is with the core Wheatons as he is still only -3 to -4 with the core group.
The more people in a group and the higher the number of markers tested the closer we get to deducing relationships. At this point it is impossible to do with the other Groups but it is my hope that eventually they will grow as well.
Anyone wishing to add markers please take advantage of the sale before Years End.
